Unified Three-Engine Monitoring
One platform aggregating three monitoring engines — covering traditional IT infrastructure, IoT industrial devices, and unified time-series storage — eliminating monitoring silos
Zabbix 7.0
Traditional IT- SNMP / ICMP / SSH / IPMI
- WMI / JMX / HTTP / TCP
- Full coverage of 10 device types
- Proxy distributed multi-tier deployment
- TLS / PSK encrypted communication
- Auto-registration & template binding
Enterprise-grade traditional IT monitoring engine with Proxy Group HA architecture, offline installation packages covering 15 OS platforms
EMQX 5.8
IoT / Industrial- MQTT / CoAP / Modbus
- Device Model & telemetry management
- Geofencing engine
- OTA Firmware Update
- Gateway → child device topology
- Automatic device heartbeat detection
Massive IoT device concurrent access, Rule Engine real-time data routing, HTTP Auth unified authentication, supports device control commands & batch configuration
VictoriaMetrics
Time-Series Storage- Native PromQL queries
- High-cardinality, high-performance writes
- 90-day historical data retention
- Millisecond query response
- Auto-injected customer_id
- CPU / Memory / Disk in one query
Unified storage for all Zabbix and IoT time-series data — resource utilization Top N, trend analysis, and health heatmaps all powered by PromQL
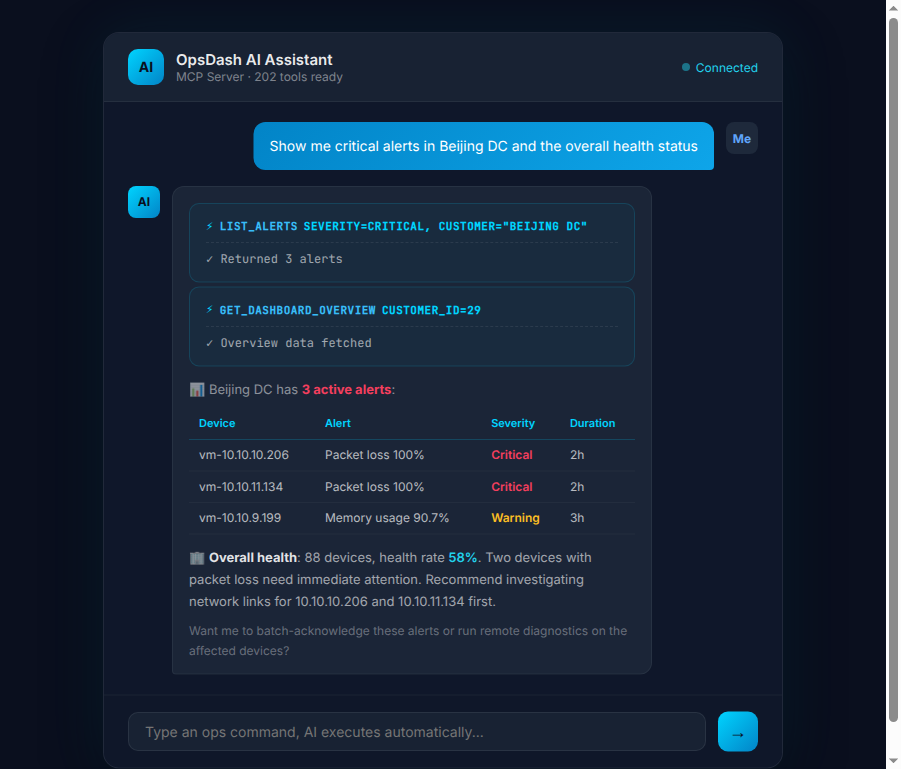
AI-Native Operations
Designed for AI agents from the first line of code — built-in MCP Server lets Claude Code, Cursor, OpenClaw, Hermes Agent and other AI assistants execute ops tasks directly via natural language
189 Standardized Tools
189 MCP Tools
Across 17 modules: devices, alerts, monitoring, remote ops, IoT, credentials, Proxy, IPMI, tags, audit, and more — full-stack coverage
6 Core Workflows
Incident triage / daily review / scan & onboard / batch import / alert storm handling / topology setup — pre-built Prompts ready out of the box
Two-Step Approval Security Model
All write operations use a prepare → confirm mechanism — AI never silently executes dangerous actions, with 5-minute confirmation expiry
11 Real-Time Resources
Ops overview, active alerts, system health, IoT summary, pending approvals, and more — real-time context that AI automatically subscribes to
Smart Alert Engine
From raw alerts to human intervention — automatic deduplication, convergence, correlation analysis, and escalation notifications, reducing alert noise by 80%+
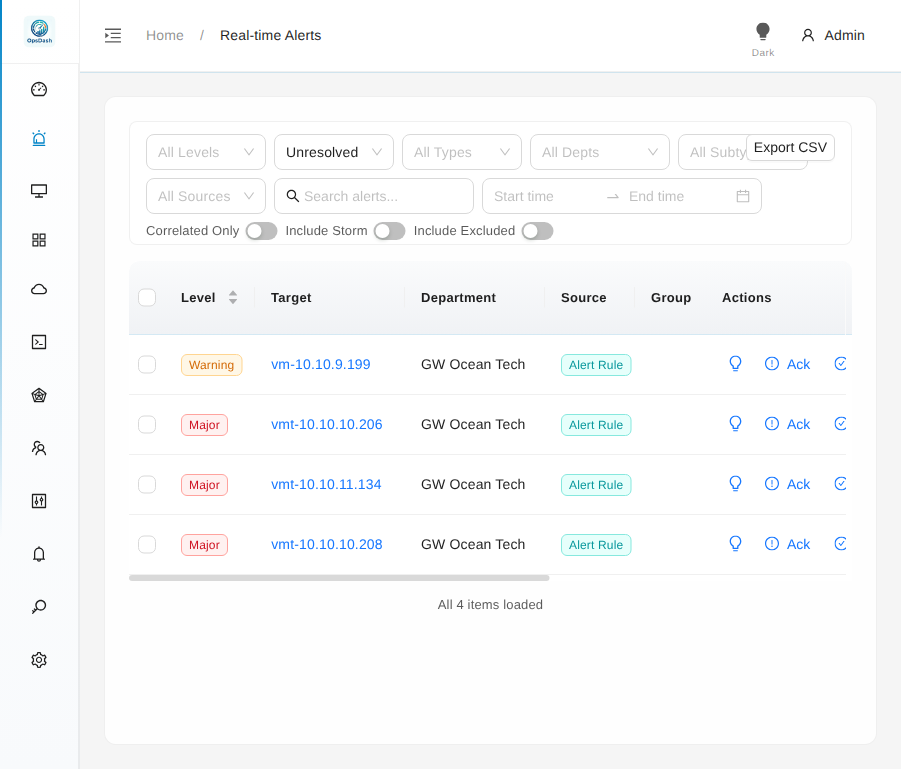
Four-Layer Smart Noise Reduction
Deduplication
Duplicate alerts from the same source within a time window are automatically merged with count aggregation, displaying only one effective entry
Storm Suppression
When alerts for a single device exceed a threshold, storm mode triggers automatically, suppressing subsequent similar alerts to prevent notification overload
Correlation Analysis
BFS topology traversal automatically discovers cascading failure chains, groups co-located devices, and rapidly pinpoints root causes
Escalation Policy
30-second polling scheduler engine — unacknowledged alerts auto-escalate by policy: Email → DingTalk → Feishu → WeCom
Multi-Channel Notifications
Email / DingTalk / Feishu / WeCom — four channels with concurrent delivery, 3 auto-retries, isolated DB sessions to prevent blocking
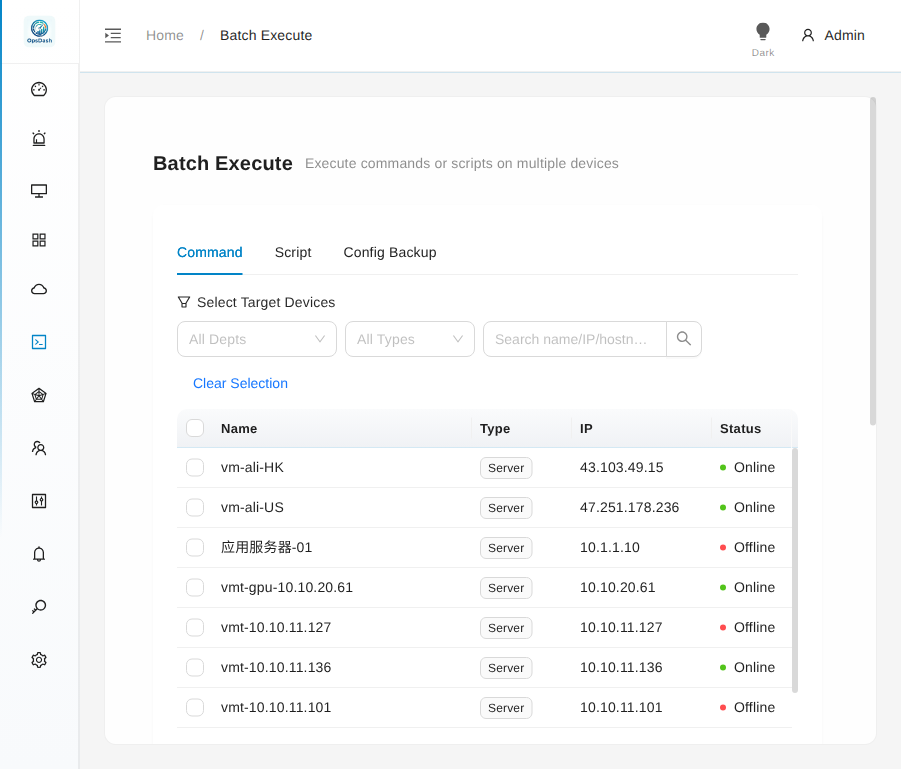
Remote Operations Center
SSH batch execution, script library, config backup, IPMI management, multi-vendor CLI support — comprehensive coverage of remote operations scenarios
Batch Command Execution
Concurrent SSH connections with real-time WebSocket output streaming, virtual scrolling for large outputs (>32KB auto file storage), with pagination and full-text search
Script Library
Parameterized template rendering with 6 parameter types (string/number/boolean/select/password/multiline), import/export, and version management
Config Backup
SHA-256 dedup storage, config change audit log, Monaco Editor Unified Diff comparison, one-click rollback
IPMI Management
Remote power on/off/restart/PXE boot, real-time sensor readings, System Event Log (SEL) queries, FRU asset information
Multi-Vendor CLI Adapters
10 built-in network vendor drivers: Huawei / H3C / Cisco IOS / Cisco NX-OS / Juniper / Ruijie / Fortinet / PaloAlto / MikroTik / Aruba
Execution Strategy Engine
Rolling / Canary / Group execution, auto-pause on failure threshold, 11 built-in risk assessment rules for dangerous commands + approval interception
DAG Topological Sort Multi-Step Pipeline
Conditional branches / variable passing / step dependencies / on_failure policies — orchestrate complex ops tasks into reusable workflow templates. Supports pause, resume, cancel, with real-time WebSocket progress updates.
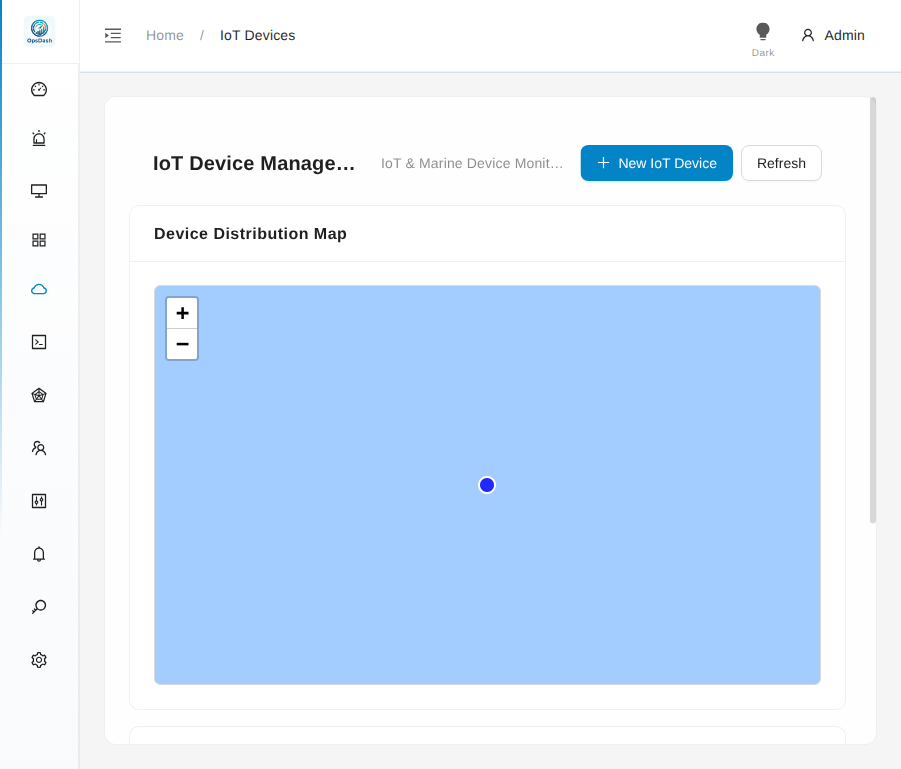
Full-Stack IoT Management
From device onboarding to data visualization, from alert templates to firmware upgrades — building a complete IoT operations loop
Six Core IoT Capabilities
Device Model Management
telemetry_specs define telemetry metric specifications, services_schema define control service interfaces, 5 pre-built environmental monitoring models ready to use
Telemetry Data Visualization
ECharts Gauge dashboards dynamically rendered by device model, turning red on threshold breach; historical line charts driven by PromQL with multi-metric overlay
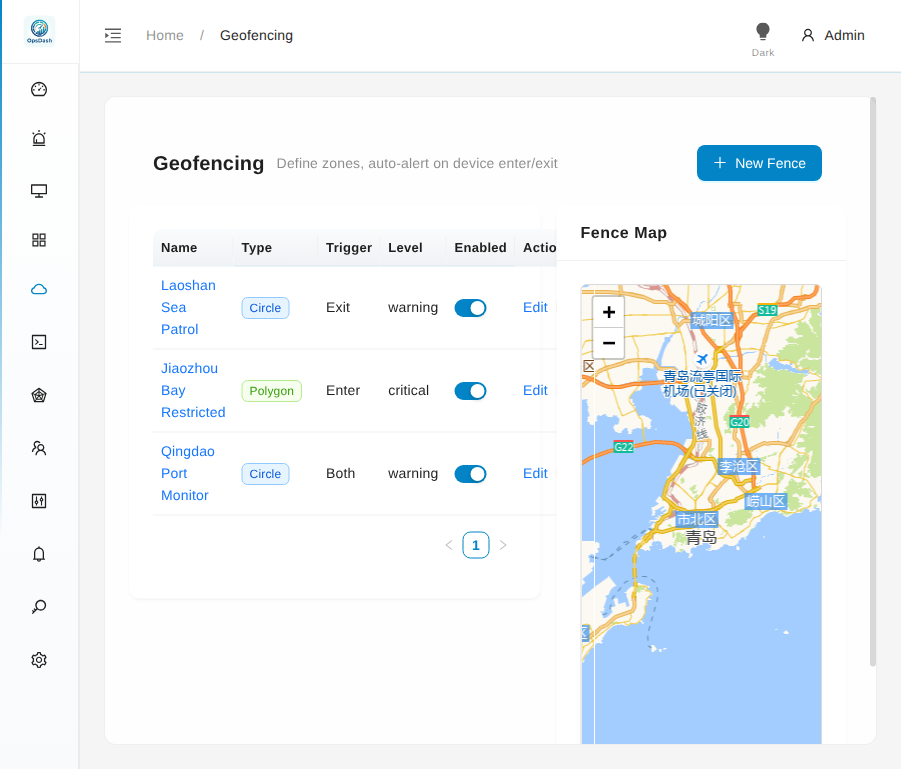
Geofencing Engine
Circle (haversine) and polygon (ray casting) dual algorithms, GPS Webhook real-time detection, automatic alert triggering on geofence entry/exit
OTA Firmware Update
Firmware version management, OTA task creation and progress tracking, MQTT notifications for device pull updates, supports batch rollout
Gateway Topology
gateway_device_id self-referencing FK builds gateway-to-child-device tree topology, with visual display of device hierarchy
Data Quality Dashboard
Completeness / timeliness / out-of-range ratio — three-dimensional radar chart for real-time IoT data health assessment with automatic anomaly tagging
Discovery & Enterprise Security
Automatically discover devices and services on the network, combined with enterprise-grade RBAC, SSO, and audit logs to build a secure operations foundation
Network Discovery
Auto Scanning
IP range / subnet scanning, SNMP / ICMP / TCP multi-protocol probing, Proxy mode for cross-segment discovery
Device Fingerprinting
TTL-based OS detection + SNMP sysDescr parsing + port combination identification for automatic device type classification
Service Detection
Open port scanning, automatic service type identification, recommended monitoring template matching
Smart Onboarding
One-click approval from scan results, automatic type inference, batch template binding, MAC/IP deduplication validation
Enterprise Security
RBAC with 5 Roles
admin / engineer / viewer / dept_engineer / dept_viewer — 43 permissions across 21 resources with department-level isolation
SSO Single Sign-On
Feishu / DingTalk / WeCom — three-platform OAuth integration for seamless one-click login
Audit Log
Full operation audit trail, automatic HTTP context capture and backfill, RequestID end-to-end tracing
Credential Vault
Fernet-encrypted storage, 10 credential types, smart matching recommendations, connectivity testing, scope inheritance (global → subnet → device type → device)
Operation Rollback
OperationSnapshot with 30-day auto-expiry, one-click undo for critical operations, supports device/software/alert rule rollback