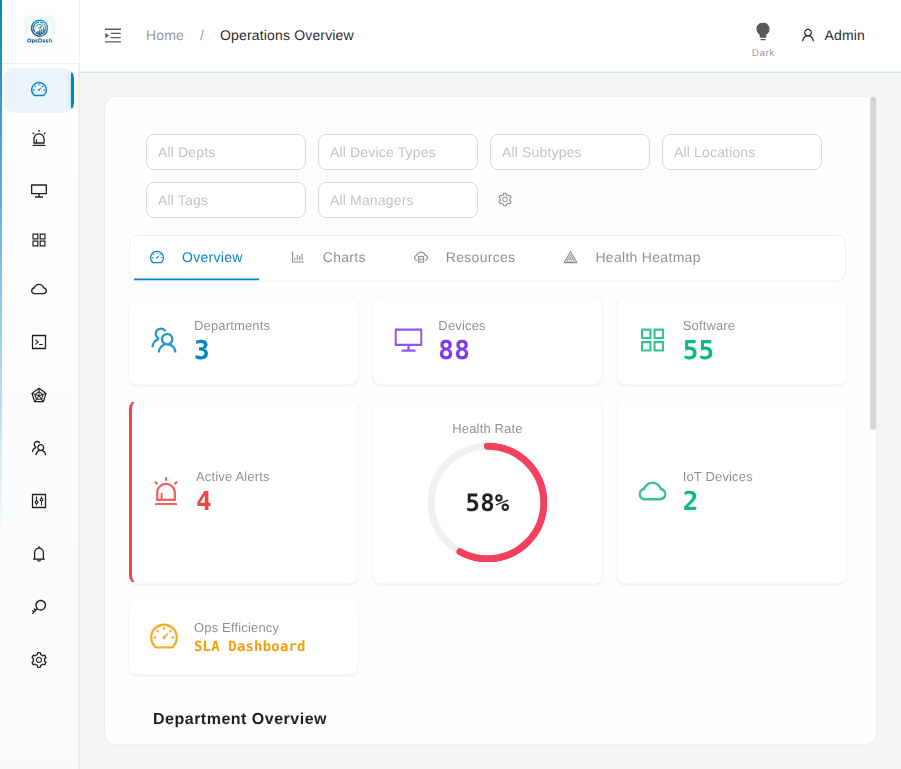
AI-Native IT Operations Dashboard

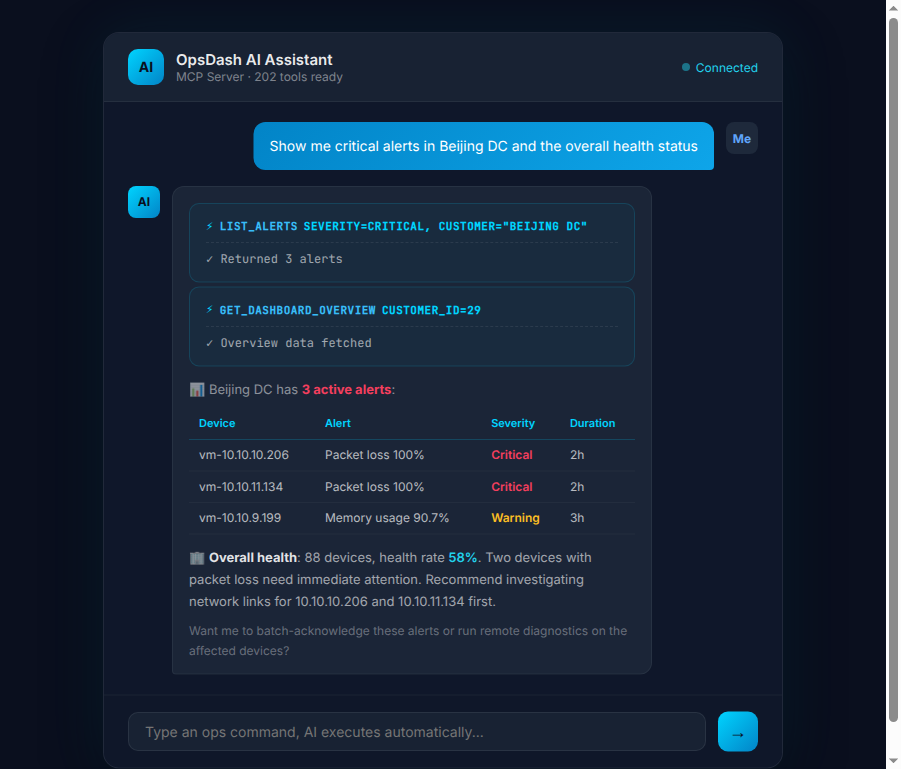
Unified Three-Engine Monitoring · 189 AI Tools · Intelligent Alert Aggregation · Remote Batch Operations · Industrial IoT
Next-generation IT+OT operations platform — let AI agents become your ops team

OpsDash Dashboard Overview
0
AI Tools
0
Monitoring Protocols
0
Device Types
0
Monitoring Engines

Unified Three-Engine Monitoring

One platform aggregating three monitoring engines, covering traditional IT, IoT industrial devices, and unified time-series storage

Zabbix 7.0

Traditional IT
  • SNMP / ICMP / SSH / IPMI
  • WMI / JMX / HTTP / TCP
  • Proxy Distributed Deployment

Comprehensive monitoring across 10 device types with Proxy hierarchical architecture

EMQX 5.8

IoT / Industrial
  • MQTT / CoAP / Modbus
  • Device Models / Telemetry / Geofencing
  • OTA Firmware Upgrades

Massive IoT device concurrent access with real-time data collection and control

VictoriaMetrics

Time-Series Storage
  • Native PromQL Queries
  • High Cardinality, High Performance
  • 90-Day Historical Data

Unified storage for all engine time-series data with millisecond-level queries

View All Features →

Core Highlight

AI-Native Operations

Designed for AI agents from the first line of code — built-in MCP Server lets Claude Code, Cursor, OpenClaw, Hermes Agent and other AI assistants execute ops tasks directly via natural language.

"Which critical alerts are in the Beijing data center?" — AI queries and returns results directly, no UI switching needed.
Explore AI Capabilities →
OpsDash AI Assistant Conversation

Start Monitoring in 5 Minutes

One-click Docker deployment, free for 20 devices, no credit card required

Get Started